Common Disease and GWAS
Design GWAS
What is GWAS?
GWAS is useful for identifying common variants with small effects that increase or decrease the risk of disease.
We want these associations to be:
- Unbiased
- Well powered
- High certainty
- Meaningful (e.g. implicate new genes)
Process of running a GWAS
Recruitmentof cases and controlsCollectDNA samples (blood, saliva, etc.)- Use high-throughput technology to assay common variants (> 1 million)
- Test every variant for association with the disease
- Find regions of the genome with significant p-values (e.g. p < 5 x 10^-8)
Example: Wellcome Trust Case Control Consortium (WTCCC)
Large-scale GWAS that aimed to identify genetic variants associated with 7 common diseases. Except for bipolar (false positive), other diseases had 1-9 associations for each disease.
Manhattan plots and locus plots
- Manhattan plots: Show the p-values across the genome
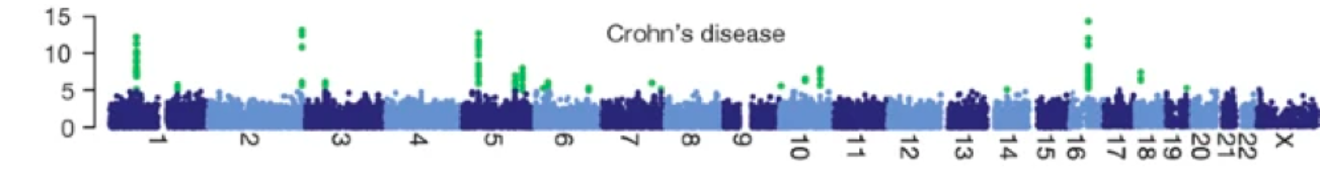
- Locus plots: Show the association of a specific region of the genome with the disease
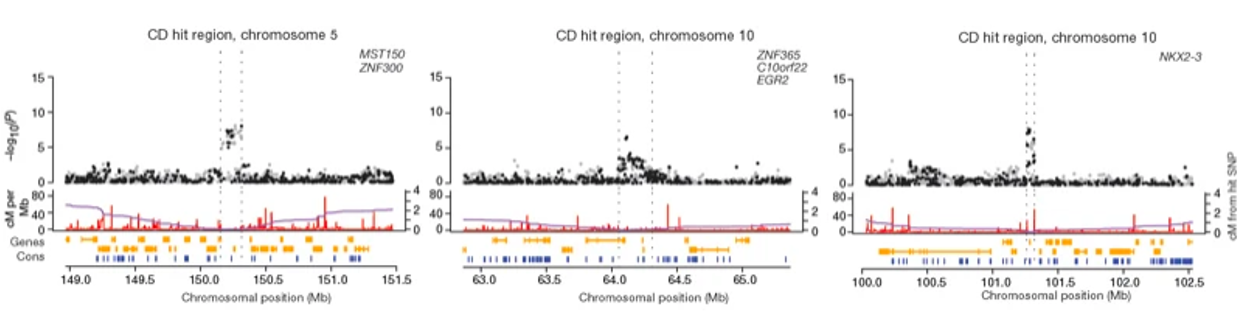
Higher sample point indicates higher significance of the association
QQ (Quantile-Quantile) plots and lambdaGC
- QQ plots: Compare the observed p-values to the expected p-values
- LambdaGC : Measure of
inflation(the deviation) of the test statistics
Under the null hypothesis, median chi-squared statistic should be 0.455. So . High inflation value means () means there is a problem (confounding) with the data.
GWAS design considerations and questions
Collecting cases and controls
- Define and recruit cases
- Define and recruit controls
- Match cases and controls for confounding
Measuring genotypes
- Genotyping technologies (e.g. microarrays, sequencing)
- Genotype imputation (i.e. inferring untyped variants)
Maximising power and reproducibility
- Replication
- Meta-analysis
Finding cases for GWAS
Strict definitions(e.g. clinical diagnosis) vsloose definitions(e.g. any symptoms)- Recruitment via
clinicsvspopulationdatasets (e.g. UK Biobank) - Define in clinic (e.g. physician judgement) vs
self-report(e.g. questionnaire)
Finding controls for GWAS
- Cases vs
population or healthy controls - Depending on prevalence
- Is the variant more common in cases or controls?
Impact of control selection on power
Lowimpact for low-prevalence diseasesHighimpact for high-prevalence diseases
Matching cases and controls
-
Cases and controls should be matched
Ancestry(e.g. ethinicity, country of origin)Technical factors(e.g. genotyping platform, batch)
-
Other factors to consider
AgeandsexEnvironmental factors(e.g. smoking, diet)
Matching can increase power
Genotyping technologies
- Microarrays: Genotype common variants
- Illumina, Affymetrix
- 60k - 4 million variants
Low cost,high throughput
Other than common variants?
-
we use genotype
imputationto infer untyped variants -
Nearby SNPs are correlated, so we can use
tag SNPsto impute untyped variants -
Need good Reference set
large,diverse, samplematchedto the study population
Work well for common variants, but not for rare variants
Other technologies
-
Low coveragewhole genome sequencingSequencing followed by imputation- Low cost
- Can be more accurate, give info about rare variants
- less routinely used
- The UK10K project
- Small sample size
- Used for imputation for chip studies for 10 years
-
High coveragewhole genome sequencing- More accurate, but
expensive - No imputation needed
- UK Biobank
- DMPK repeats can only be detected by sequencing
- More accurate, but
Replication in GWAS
Independent cohortIndependent technology
Advantages of replication
- Reduce
false positives- Reduce the chance of false positive study to < 1%
- Mitigates confounding or technical artefacts
- False positives by population stratification by
different countrywith differentpopulation structure - False positives by
different genotyping technology(e.g. chip used)
- False positives by population stratification by
- More accurate effect size estimation
Winner's curse:Significant associationstend tooverestimatethe true size of the effect.- Replication can give a more accurate estimate
Meta-analysis in GWAS
Combineresults frommultiple studiesto increase power
Running GWAS
What affects GWAS?
Bad QC (Quality Control) > Bad Data > Bad Results
Quality Control steps
Sample QC
- Sample Call Rate
- Remove samples with low call rate
- Autosomal Heterozygosity
- Remove samples with deviant heterozygosity
- Caused by
inbreeding,contamination,Ancestry,Data quality- Heterozygosity more likely to be missing
- Sex / Gender check (X chromosome Heterozygosity)
- Sex check, mislabelled samples
- Identity by descent (IBD) if too much relatedness
- Exclude related samples
SNP QC
- SNP Call Rate
- Calculate call rate for each SNP
- Remove SNPs with low call rate
- Hardy Weinberg Equilibrium (HWE)
- Remove SNPs with significant deviation from HWE
- Useful for random mating population
Confounding PCA if too little relatedness
- Summarizing many variables with minimal loss of information
- Need
clean non-correlated data - PCA can reveal
- Population outliers
- Population structure / confounding
Interpreting the results of GWAS
Finding risk variants and risk genes
-
Hard to pick because of
Linkage Disequilibrium (LD) -
Fine mapping
- Association in a
region - Use
Posterior probabilityto find thecausal variant - 95% credible set might not be enough
- Association in a
-
Finding function of a causal variant
- Questions:
- Does it modify protein code?
- Does it in Promoter, enhancer, or other regulatory regions?
- Does it affect expression?
expression quantitative trait locus (eQTL)GTEx projectcan be used to find eQTLs
- Chromosome conformation capture (3C) and Hi-C
- Find
variant-enhanceraffects
- Find
- Finding the genes that are
closestto the variant Locus-2-genemethod, machine learning method to give a score to each gene
- Questions:
Genetic architecture - how heritable is the trait
- SNP heritability
- Variance in the trait that is driven by variation in the SNPs in the study
Methods to estimate SNP heritability
CGTAuseGenome-based restricted maximum likelihood (GREML)method to estimate heritability of a trait. It is trying to find formore closely related individuals, themore similar their traits arecompared to less related individuals.LD Score Regressionmeasures heritability with test statistics and accounts for inflation.LD score slope > 1 means confounding, > 0 means true heritability.
Finding pathogenic cell types and pathways
- Enrichment testing for GWAS data
- We want to know is GWAS signal enriched in some set of variants or regions of the genome.
partitioned LDSCcanstratify heritabilityinto differentcategoriesof variants.
Finding relationships with other traits
- Co-heritable traits: if the risk for one trait is associated with another trait.
- By
causal relationship - By
Shared pathways
- By
- Measuring
genetic correlationbetween traitsLDSCmethod
Menelian randomization can be used to find causal relationships between traits
Making polygenic risk scores
Polygenic risk scores (PRS): See Polygenic Risk Scores
Test the model in an
independent cohortto see if it works otherwise it isoverfitting
- A top-hit PRS, select
independent,genome-wide significant variants, usenormal estimated effect size. - A prune-and-threshold PRS, Set of
SNPs not in LD, use variants withp-valuebelow athreshold, normal estimated effect size. - Genome-wide shrinkage, Use Bayesian prior to shrink the effect size of the variants. Use LD to “spread” the effects across correlated variants. e.g.
LDpred2
Genome-wide shrinkage is better than top-hit PRS and prune-and-threshold PRS.
Trans-ethnic PRS
Population is important for GWAS. If the population is different, the PRS will be affected.