Introduction to clinical variant interpretation
Scene setting
- Accurate diagnosis
- Familial Screening
- Inform prognosis
- Personalized treatment
Overview of Rare Variant
1 million variants per person
~1% are protein-coding
Finding one variant that causes a disease is like finding a needle in a haystack.
Overall aim
PathogenicLikely pathogenic- Unceartain significance
- Likely benign
- Benign
Clinically actionable
For each variant:
- Have we
seenit before? - What do we
knowabout it? - What can we
predictabout it? - What new
datawe added?- From this
family Experiments
- From this
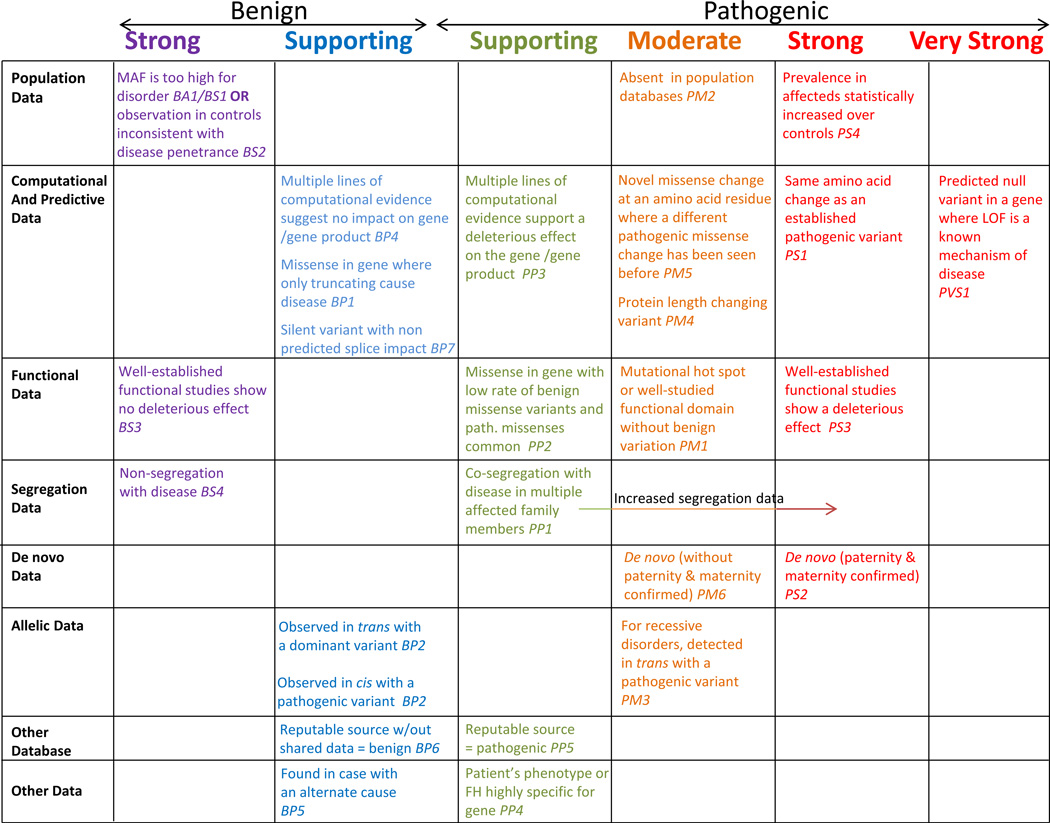
ACMG/AMP guidelines
A Bayesian framework
- Start with a
priorprobability - Modify it with set of
odds, orlikelihood - Get a
posteriorprobability
Pathogeneic: posterior probability > 0.99
Likely pathogenic: posterior probability > 0.9
Uncertain significance: posterior probability 0.1 - 0.9
Choosing a prior:
- Variant in small panel testing / large population screening
- In the range for VUS
- Use 0.1 (Empirical for BRCA1/2)
Advantages:
- Incorporate Benign and Pathogenic in one step
- Can compute odds of pathogenicity for each rule strength to test against functional assays or other metrics
- More flexible
Evidence
Variants in patients
Similar phenotypes
How many variants?
Patient denominator is often unknown
Very unbalanced sample sizes
Use ClinVar to find variants that have been seen
before.
Some cautions on using ClinVar data:
- Bias in certain genes and variants types
- (Likely) Pathogenic variants are more likely to be submitted
- Unclear about variant classification
- Historical 'literature` only curations
- Data not versioned - classification can change
Functional Data:
Matchmaker exchangeLitVar- PubMed
Segregation Data:
Segregation with one or more families
Caution:
- reduced penetrance
De novo occurrence
In controls:
- Healthy, or population
- At what frequency?
Allel frequency is one of the strongest predictors of benignity, but is not an indication of pathogenicity.
Population datasets:
gnomAD,UK Biobank
Not disease free, expect disease frequency at the same rate as the general population
Allele Frequency (AF)
\[\text{AF} = \frac{\text{number of alleles with variant}}{\text{total number of alleles}}\]
Dominant Disease: < 0.1%
Recessive Disease: < 1%
The proportion of individuals with a variant that develop the disease
is the penetrance.
Penetrance:
- Measure on variant or gene level
- Often difficult to measure
- Threshold of disease
familybased measures areoverestimatesbiobankslikelyunderestimates- variants are often very
rare/ unique to individual families
Disease-specific statistical approach:
A penetrant dominant mendelian disease
\[\text{Max AF} = \frac{\text{Disease Prevalence} \times \text{heterogeneity}}{\text{Penetrance}}\]
Heterogeneity: maximum proportion of disease attributeable to single variant
Popmax filtering AF (FAF):
Highest allele frequency in any population
if Popmax FAF > Max AF = Too
common
Limitations:
- Low converage: absence does not mean rare
- Ethnicity: founder variants
Other evidence
Highly specific phenotypes that matches gene
Observed in trans with known pathogenic allele
Similar to previously reported pathogenic variant
Future direction
Moving towards a points based system
Confirming and refuting disease-gene links
GenCC can be used to know the gene and variant that
relates to a disease.
PanelApp: Red, Amber, Green
- Red: No evidence
- Amber: Some evidence
- Green: Strong evidence
Experts review the genes and classified to the above categories.
Can be used to determine which variants are diagnostic candidates.
ClinGen: Literature only curation of variants
Burden testing can be used to determine if a gene is associated with a disease
- But
- Need large sample sizes
- Uniform phenotyping
- Well matched controls
- Normally limit to rare variants of a particular class
- Small genes may not be significant
- Many false disease-gene claims are made
Good Example:
MYH7in dilated cardiomyopathy
significat in ClinVar, Genebass, GenCCBad Example:
CTNNA3in ARVC
OMIM disease association
Limited evidence in GenCC and Genebass
Three classification in ClinVar in gnomAD, many VUSs, limited evidence
Conclusion:
- Many disease-gene links are not well supported
- There are many resources to help determine the strength of a disease-gene link
Measures of variant pathogenicity and genetic constraint
Variants with less frequently are more likely damaging.
Modelling mutation rates
To detech genes, regions of genes, or variant types that are under constrained or depleted of variation.
Detect shiftsin allele frequency spectrum (deleterious variants are rare)Measureadepletionof variants compared toneutralexpectationConservation:
- Comparison across species (position, region, gene throughout evolution)
- Requires small number of genomes from different species
Constraint:
- Within human measure
- Detect Human regions
- large number of human genomes
???????????????????????????????????????????????????????
Mutability adjusted proportion of singletons (MAPS)
Used to detect the shift in allele frequency spectrum.
More loss-of-function variants should have higher proportions of singletons.
some genetic context is more mutable than others.
Example: C>T at methylated CpG sites
\[\text{MAPS} = \frac{\text{Observed singletons} - \text{Expected singletons}}{\text{Observed variants}}\]
Useful for well-known variant classes
Measuring LoF compared to expected
A mutational model for predicting number of variants
Gene level constraint metrics
LOEUF: rank all genes to tolerance to LoF variants, low score indicates
haploinsufficiency.Regional missense constraint
MEF2Chas a N-terminal DNA binding domain- Missense variants in this region cause Developmental Disorders
Amino acid level constraint
Non-coding constraint
It is useful for dominant early onset phenotypes
Example: BRCA1
But:
- Ignore some variant contexts
- Resolution is limited
Can't assess individual variants
Individual variant pathogenicity
Majority predicting the deleteroiousness of missense variants
SIFT / Mutation assessor / GERP: sequence and evolutionary conservationPolyPhen2: Protein sequence and structureMutPred/Mutation taster: Machine learningREVEL: Ensemble of predictors
Others:
SpliceAI: Predicts the effect of variants on splicingCADD: Genome-wide tools
All these tools are
supportinglevel in ACMG/AMP guidelines, meaning they havelimitedevidence
Generally, REVEL for missense, SpliceAI for
splicing, CADD for Genome-wide
Conclusion
Computational tools are useful to determine genes/regions/variant types that likely to be deleterious
Predicting the deleteriousness of underlying data including constraint and cross-species conservation
Used with ACMG/AMP guidelines
Glossary:
Dilated Cardiomyopathy: a condition in which the heart becomes weakened and enlarged and cannot pump blood efficientlyVUS: Variant of uncertain significanceARVC: Arrhythmogenic right ventricular cardiomyopathy, a genetic disorder that affects the heart musclehaploinsufficiency: a condition in which a single copy of a gene is not sufficient to maintain normal function